Maybe you are an imposter
You feel like you're not as good as everyone else, but you've heard of imposter syndrome. Maybe you actually are an imposter? Or maybe there's more to it.
June 5, 2020
(Note: Throughout, I'm going to be loose with my phrasing and say things like "X is 10% as good as Y," where X and Y are people. But we all know reality isn't this simple.)
You've probably heard of impostor syndrome. Maybe you've even experienced it: you don't think you can meet other people's expectations, and sooner or later, everyone's going to find out that you're an incompetent loser. And then, of course, your life will be completely ruined. Something like that.
To make the situation more stressful, you can't tell if you have impostor syndrome or if you're actually a loser. After all, thinking that you're a loser is the defining symptom of imposter syndrome.
It's kind of like a real-life barber paradox: suppose a barber shaves those who don't shave themselves. Does he shave himself? Either answer leads to a paradox. Except in your situation, you fear that there's actually no paradox: you think you're a loser, and you don't have imposter syndrome because you actually are a loser.
So what can we do about it? Unfortunately, I think most of the common "solutions" are unsatisfying. Allow me to illustrate from the perspective of a (petulant) victim.
"Know that it's common." Listen, it doesn't matter how many people have imposter syndrome. Like I said, I'm actually a loser.
"Talk to others about it." What if they have no idea what I'm talking about? Or worse, what if they also think I'm a loser, but they're too polite to tell me?
"Stop comparing yourself to others." I'm sure my interviewer isn't comparing me to other applicants. Because each one of us is a unique snowflake. Sheesh.
"Own your successes and praise you receive." Do I even need to say anything? I don't have any successes, and nobody praises me.
In my opinion, these "solutions" only apply if you're not actually an imposter. They don't address the crux of imposter syndrome: what if you actually are an imposter?
1. Performance distributions
Instead of focusing on how we can "overcome" imposter syndrome, let's first consider why we experience it in the first place. Then, maybe, we can actually overcome it. After all, you need to inspect your car before you can fix it.
(Of course, I'm sure there are psychological factors that cause some people to experience imposter syndrome more severely than others. But for now, I'd like to discuss a more quantitative explanation.)
The main idea is this: reality is not normal(ly distributed). In other words, our mental models of reality are often inaccurate, and this leads to unsound conclusions.
When we think about measurements, our minds often default to the "bell curve." After all, our heights, weights, and IQ scores all follow this curve.
The most familiar example is the score distribution for a college course: there are typically lots of scores around 80, some in the intervals 70-75 and 85-90, and relatively few scores in the 60's and 90's.
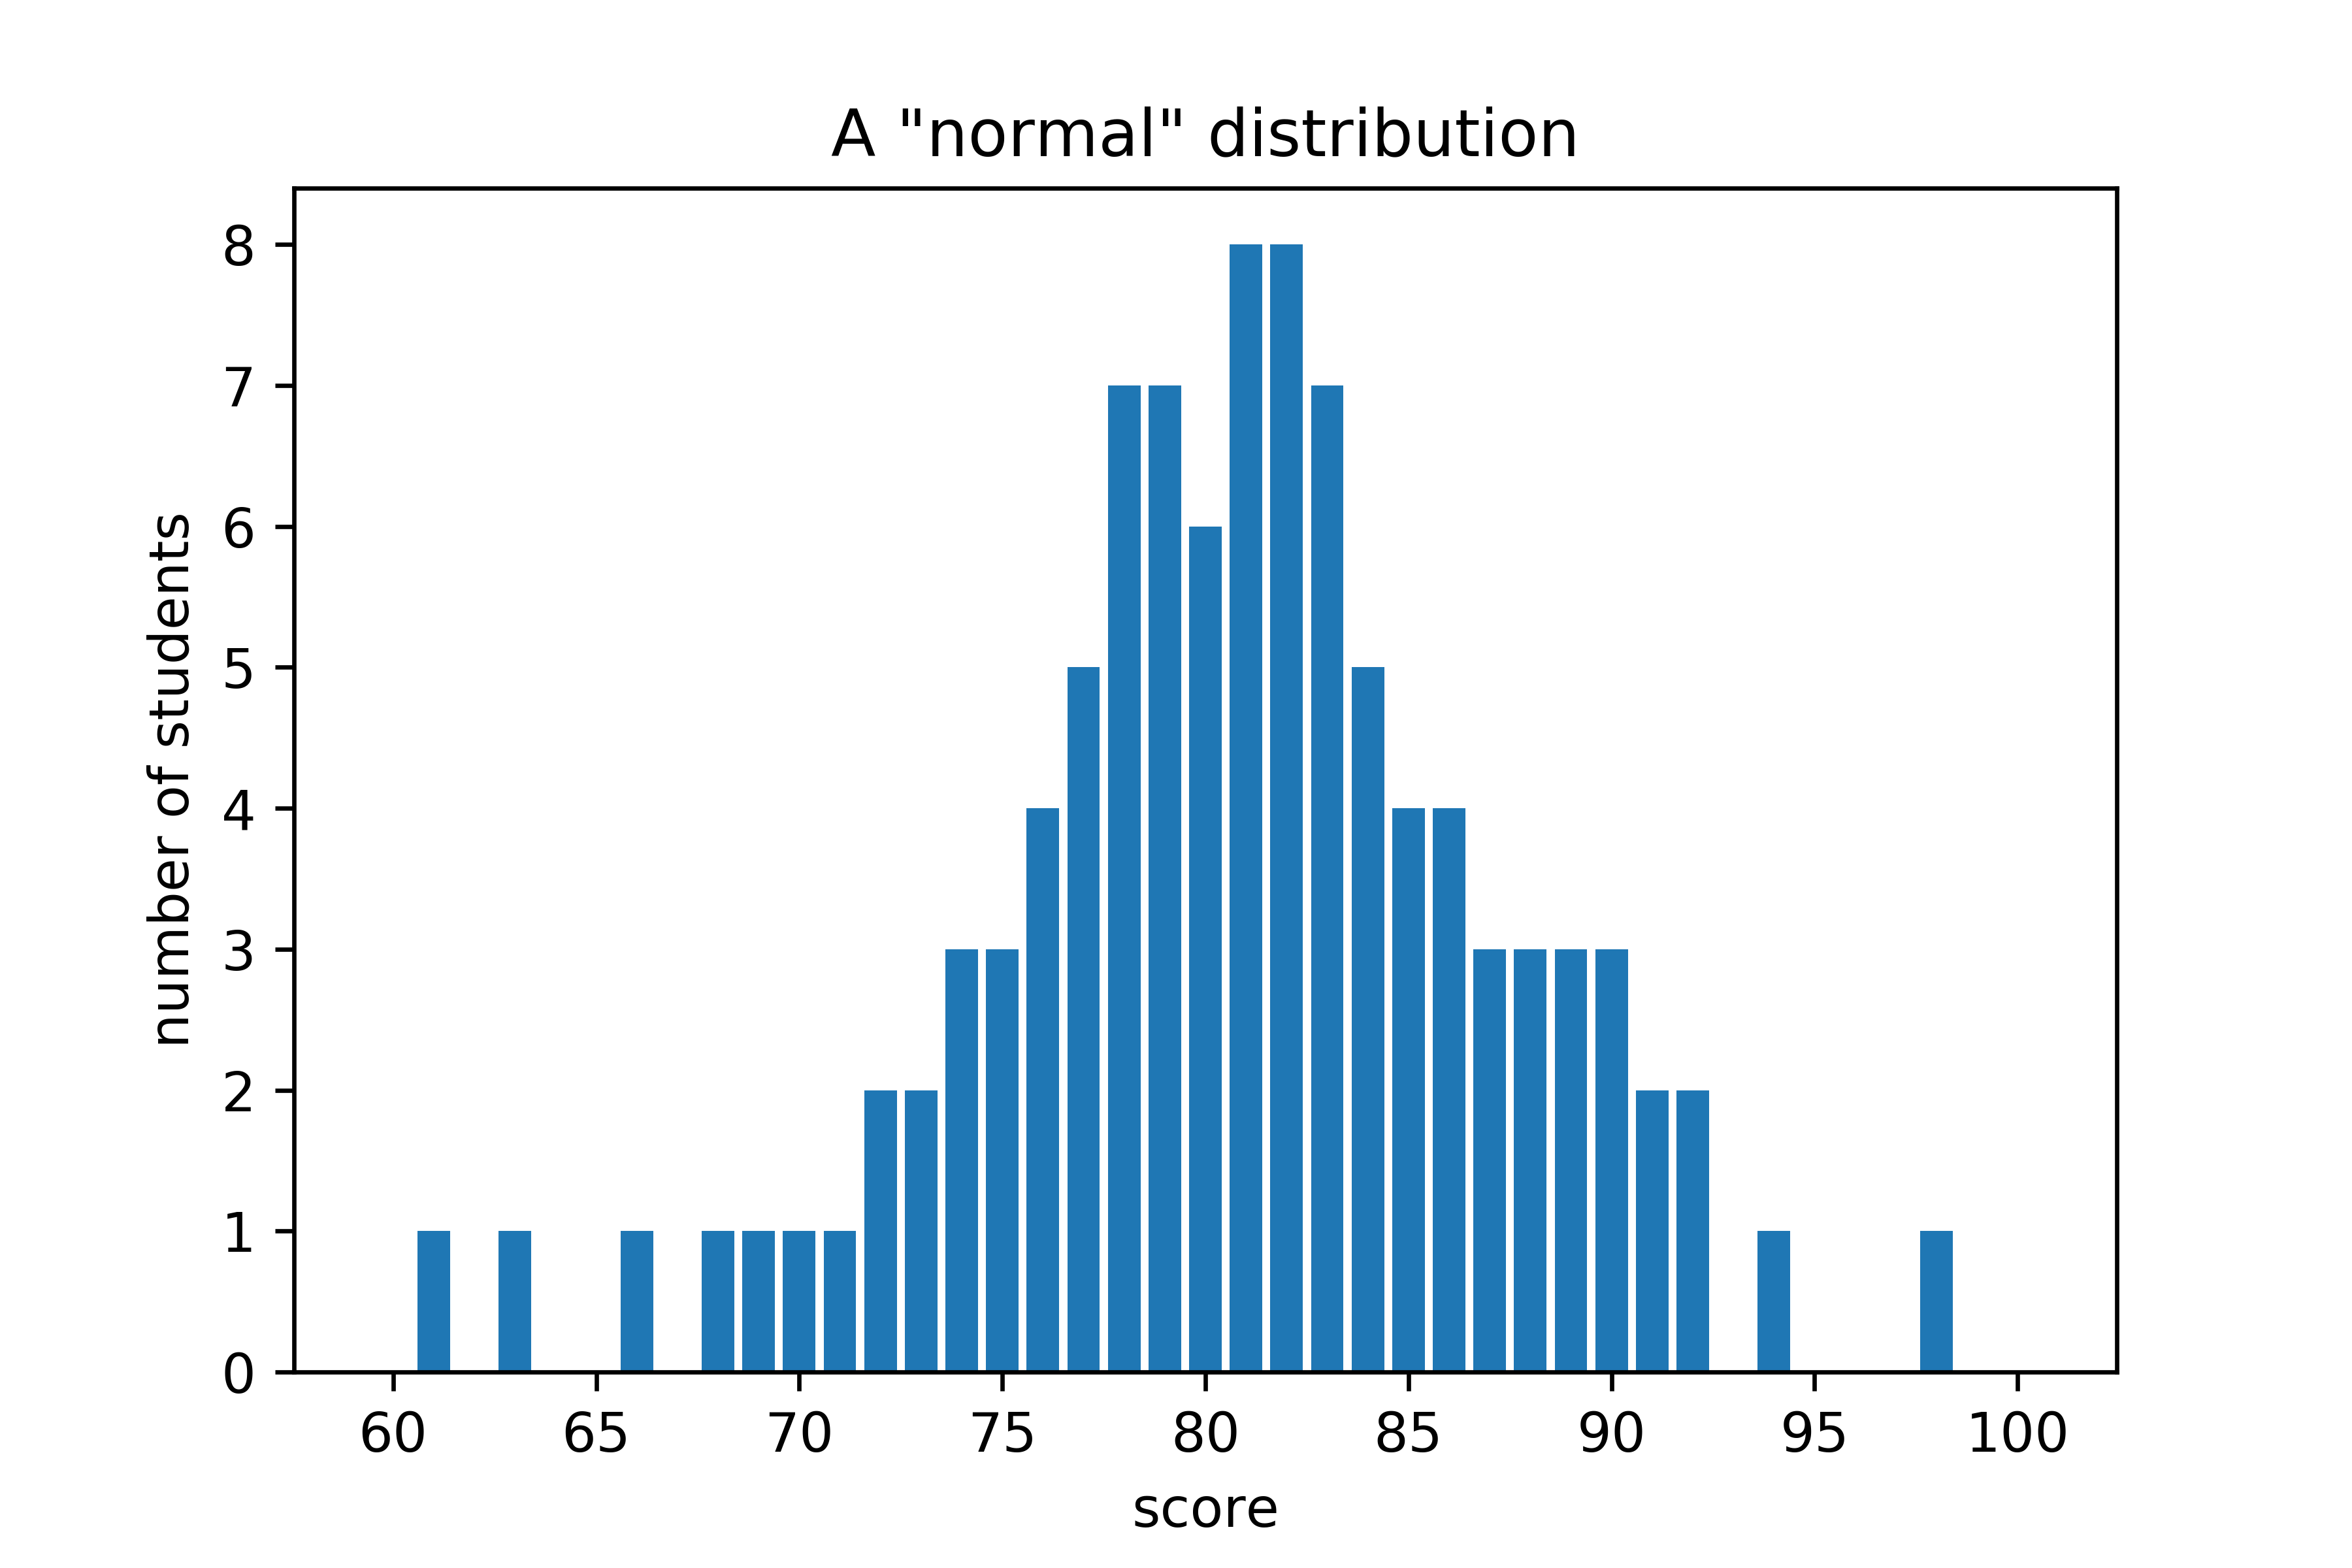
Figure 1. A typical score distribution for a college course. There are a total of 100 students, and the maximum possible score is 100.
However, real-life evaluations (unlike college exams) aren't designed to produce a bell curve. Furthermore, there's usually no notion of a "maximum" score, so the "gaps" among the top scores could be arbitrarily large. For example, there is (virtually) no universal upper bound on the number of awards someone can receive, the number of papers they've published, or the amount of money they have.
As a result, the actual curve for performance is a power-law distribution: lots of low scores, and a few super-high scores.
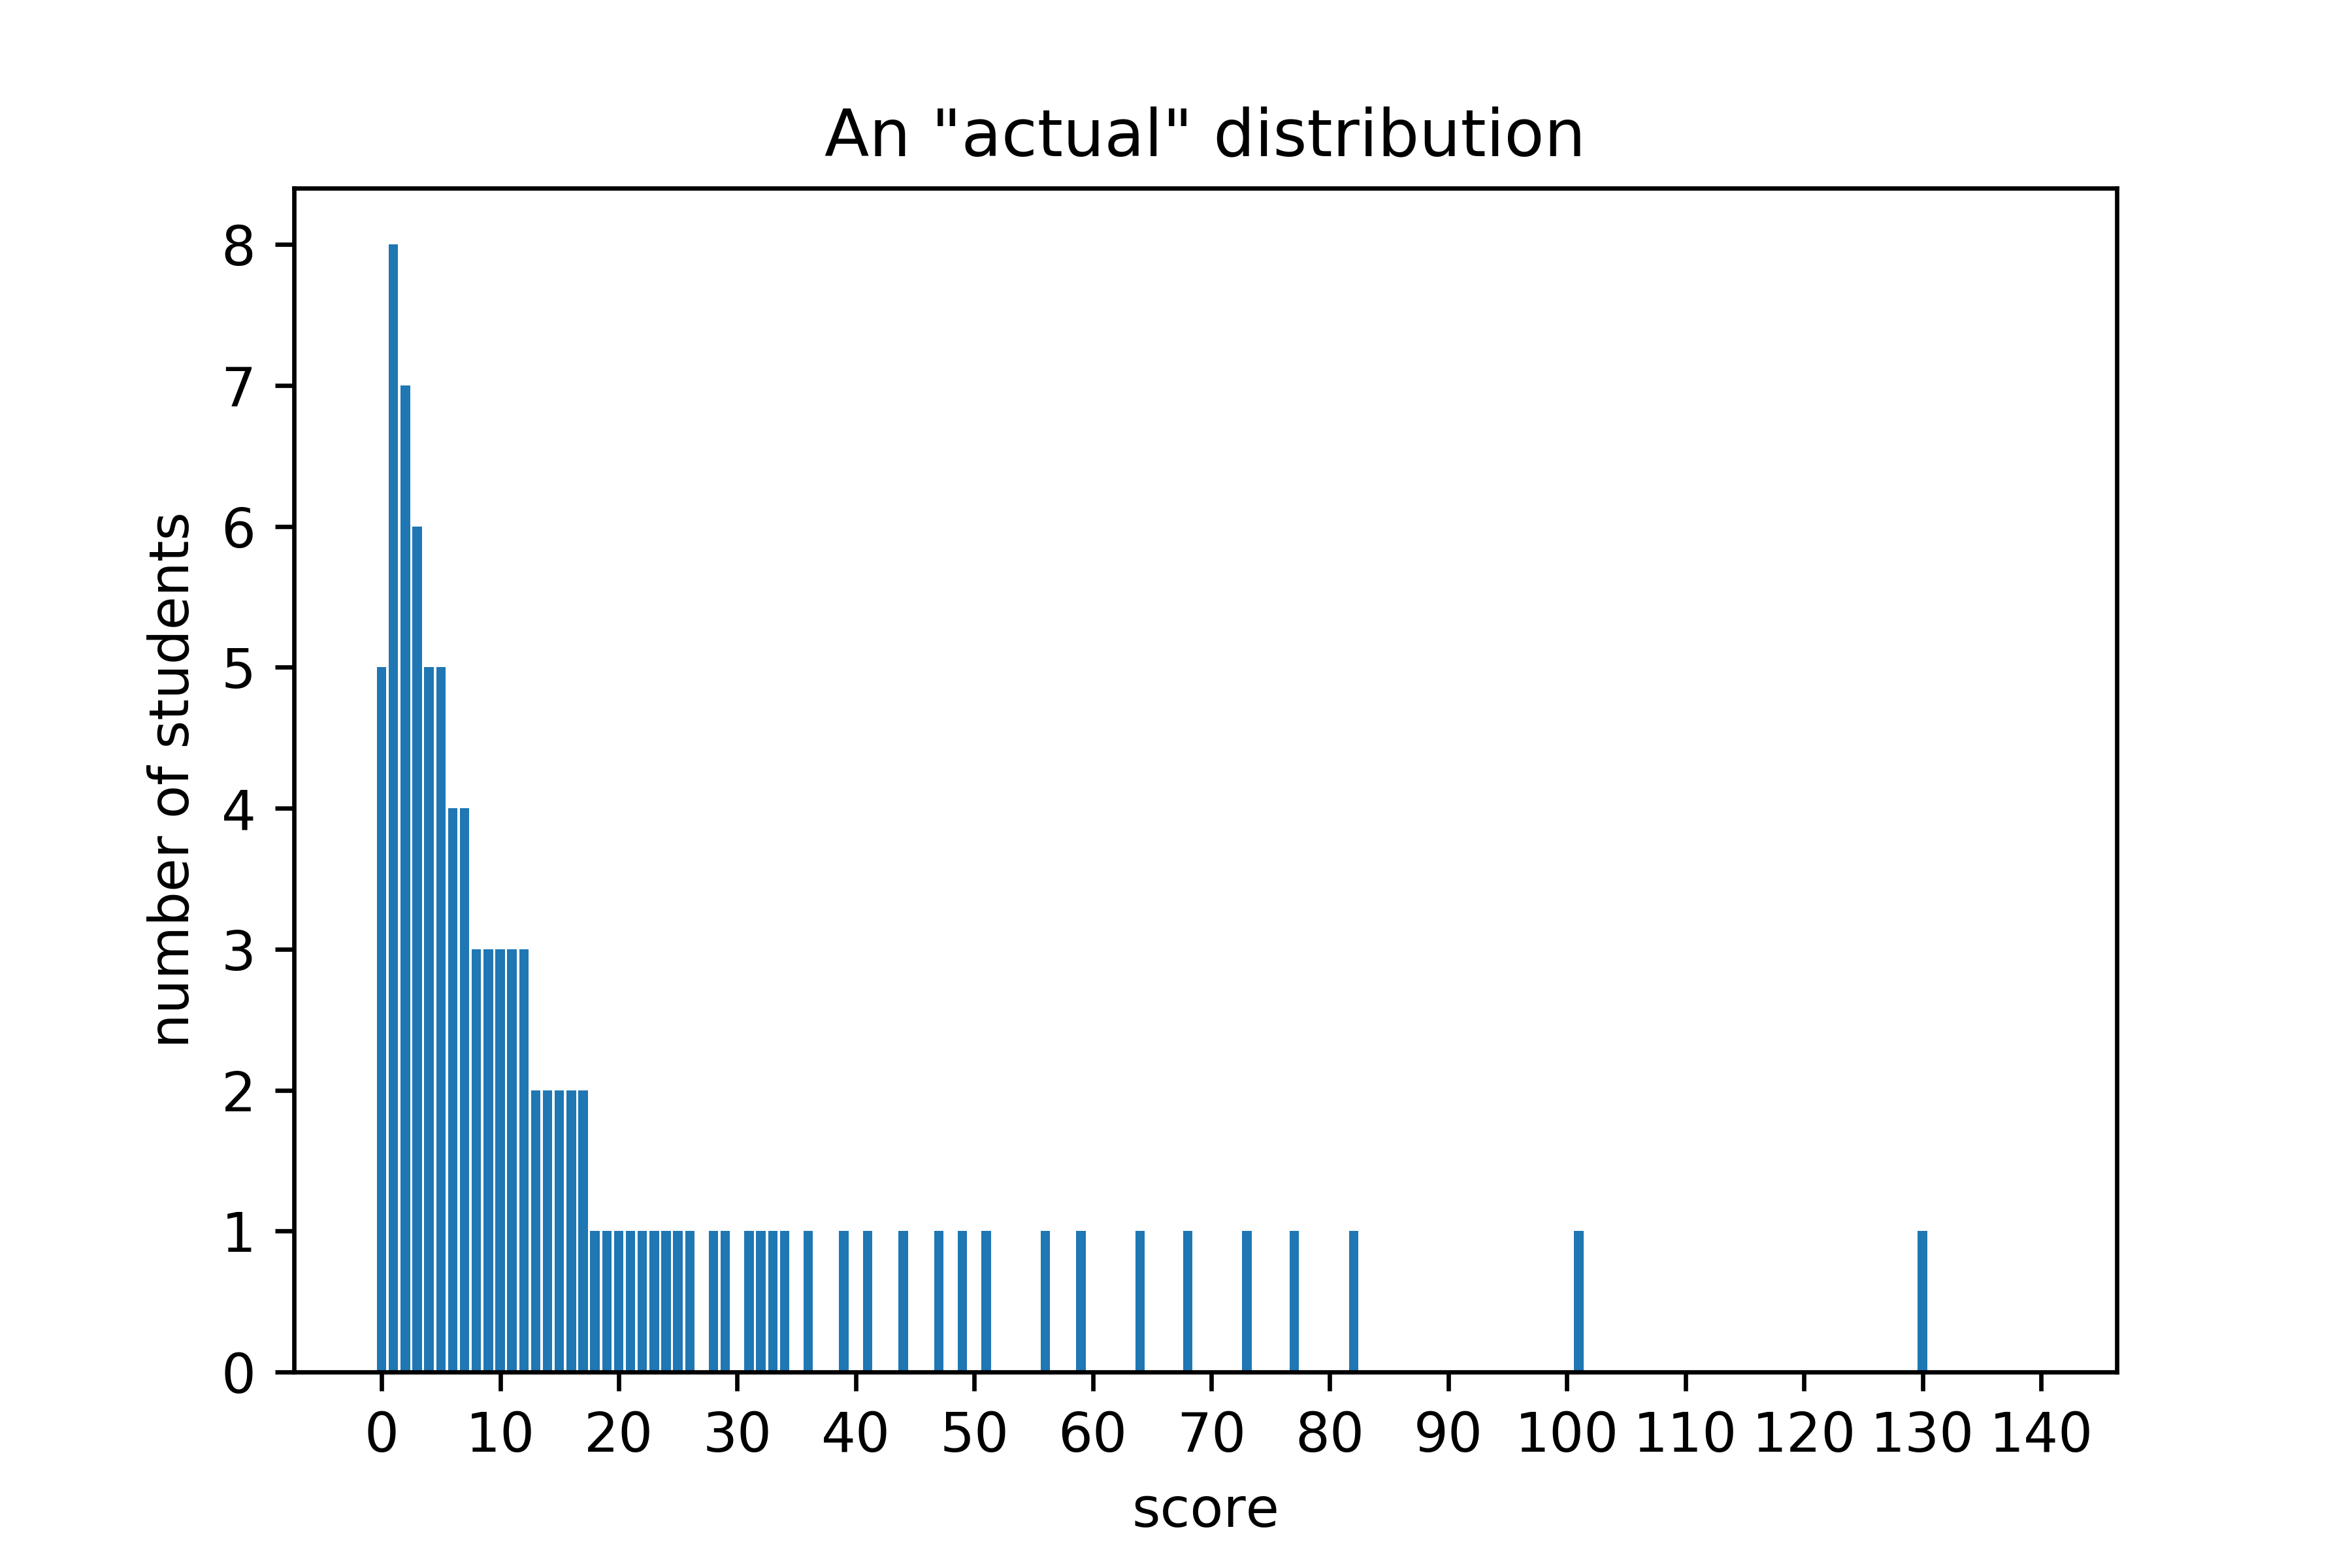
Figure 2. A distribution for performance in the "real world." There are still 100 "students," but now there's less symmetry and no cap on the maximum possible score.
Figures 1 and 2 both include 100 people, but the curves are obviously very different. So if you think your situation is Figure 1, but it's actually Figure 2, then any conclusions you draw will probably be incorrect. Let's see some of the differences.
| Figure 1 ("normal") | Figure 2 ("actual") | |
|---|---|---|
| People below average | 46% | 70% |
| Average score vs. #1 score | 81.6% | 14.1% |
| People below 10% of the #1 score | 0% | 59% |
| Top 10% score vs. #1 score | 90.8% | 39.2% |
| Total score of top 10% vs. total score | 11.3% | 41.4% |
To me, the most striking statistic is the fourth row: let's say you're the tenth highest scorer. In a normal classroom setting, you'd be almost 91% as good as the top scorer. But outside the classroom, you're only 39% as good.
And chances are, you're not in the top 10% — you're probably not even average, since 70% of people are below average (according to Figure 2). In fact, more likely than not, you're not even 10% as good as the best student. If classroom scores reflected reality, you wouldn't even score a 9/100. That's terrible! You must be an imposter!
The good news is this: by the same reasoning, lots of other people are also imposters. I mean, 90% of people are only contributing 59% of the points. So if you still think you're not "good enough," remember that most people, on average, aren't carrying their weight either.
The other good news is this: if you even consider yourself as part of some "actual" distribution like Figure 2 (even if you're at the bottom), then you're being plotted against a group of high performers. Don't forget that there's actually a huge number of people who aren't even good enough to be on the chart.
2. A concrete example: NBA All-Stars
Let's see an actual example of the "actual" distribution in professional basketball. Each year in the NBA, a handful of players are recognized as "All-Stars" for their exceptional performance that season; many players are selected multiples times throughout their careers. Here's the plot for total All-Star game selections (1951-2020).
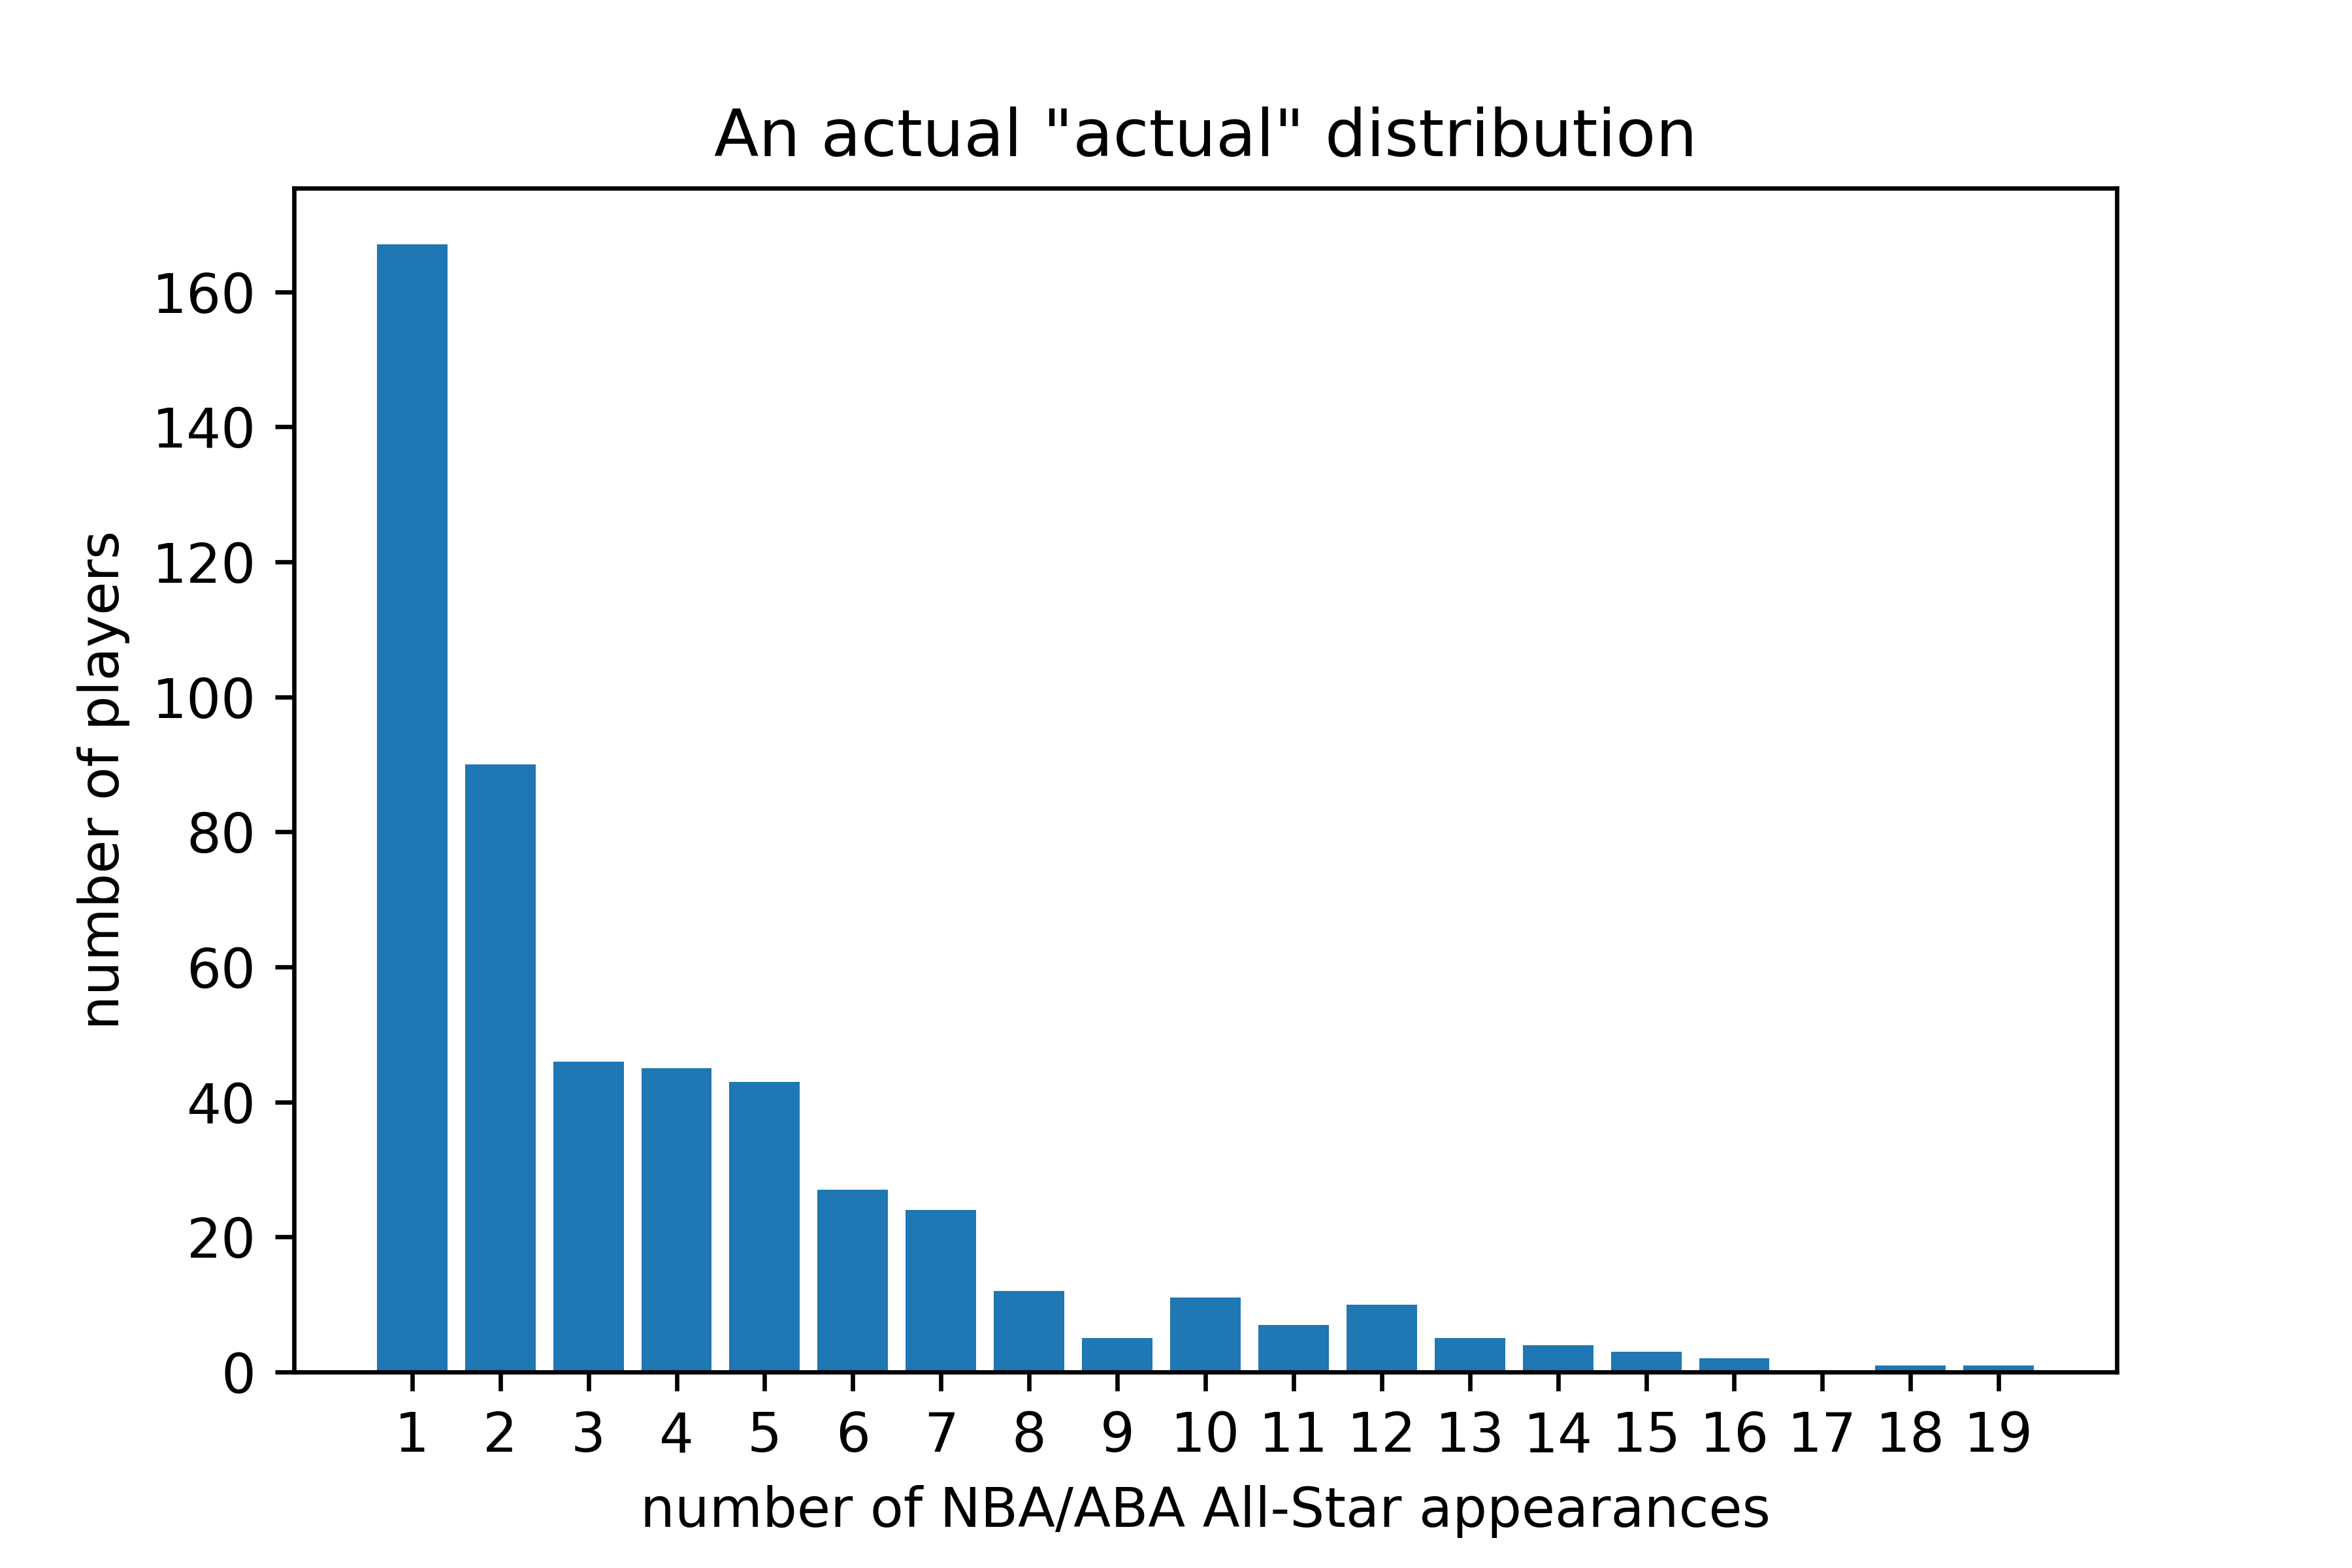
Figure 3. There's been a total of 503 All-Stars, and the maximum number of appearances is 19 (set by Kareem Abdul-Jabbar).
Now let's fill out our table for this figure.
| Figure 1 ("normal") | Figure 2 ("actual") | Figure 3 (actual "actual") | |
|---|---|---|---|
| People below average | 46% | 70% | 60.2% |
| Average score vs. #1 score | 81.6% | 14.1% | 19.8% |
| People below 10% of the #1 score | 0% | 59% | 33.2% |
| Top 10% score vs. #1 score | 90.8% | 39.2% | 42.1% |
| Top 10% vs. total | 11.3% | 41.4% | 31.4% |
The numbers aren't quite as telling as they are for Figure 2, but the idea is the same. The average All-Star is better than 60% of all All-Stars. A third of all All-Stars aren't even 10% as good as the highest-scoring All-Star (who, coincidentally, is also the current leader in NBA career points). Even a top 10% All-Star is only 42% as good as him. And so on.
So if you're a first-time All-Star, maybe you're looking at Figure 3 and thinking you're a loser. After all, you are in that 60.2% of "people below average." And you're only 6% as good as Kareem, the #1 All-Star. But keep in mind that there's a huge spike at "0" that's not in Figure 3, and you're better than all of those people (at being an All-Star, at least).
But if you are in the "0" spike, then you're still better than the top 1.2% of college players. And if you're a college player, then you're still better than the top 3.5% of high school players. Each level contains the best players from the previous level. (Of course, some top players choose to quit basketball early, but I believe this is uncommon.)
3. Summary: feeling the tail
So you think you're a loser — way worse than your top peers. You think their score is 100, and your score is 0. According to the normal distribution, most scores are around 40-60. So naturally, you conclude that pretty much everyone is way ahead of you.
But here's the catch: real-life performance does not follow a normal distribution. Instead, it follows a power-law distribution. And based off this distribution, we can make some counterintuitive conclusions, such as the following.
A super-majority of students are below average.
The average student is much worse than the top student.
Most students, including many top students, are not even close to the top student.
Now, "feeling like a loser" sounds pretty justified. But that doesn't make the feeling go away. I feel like I should give some advice, though I definitely don't have it all figured out. What should we call that feeling?
Let's call it "feeling the tail" instead (like "feeling the burn," but more abstract). By "tail," I'm referring to the "right side" of Figures 1 and 2, i.e., the part where the curve tapers off. (In Figure 1, the tail is roughly 85-100; in Figure 2, it's 5-110). Thinking that you're far from the tip makes sense: real-world distributions have longer tails than normal distributions.
When you accomplish something (e.g., get hired, receive new responsibilities, become an NBA All-Star), you're now competing with a new set of people — people who have also accomplished this thing. As you stand at the top of your new curve, on the skyscraper at "0" or "1," you see the high-scorers, way out in the distance. "Who are these people, and how are their scores so high? Do I even belong here? Where are my fellow low-scorers?" Lost and afraid on this curve, you feel like a loser.
But don't forget (cue the inspirational music) — you're on this curve because you accomplished something. Becoming aware of those high-scorers means you've progressed. Maybe you can't see them, but there are lots of people in a position similar to yours. So perhaps you shouldn't feel like a loser — you're just feeling the tail.